Friday, September 3, 2010

NOAA Log #6

 Salmon Vampires and Birds.....                                               

NOAA Teacher at Sea: Natalie Macke
NOAA Ship: Oscar Dyson       Mission:  BASIS Survey
Geographical area of cruise: Bering Sea      Date: 9/2/2010
Weather Data from the Bridge :
Visibility :  10+ nautical miles (Wondering what a nautical mile is??)
Wind Direction: From the SE at 12 knots
Sea wave height: 2-3ft      Swell wave direction: 3-4 ft NW
Sea temp:9.9 oC    Sea level pressure: 1014.4 mb    Air temp:  11.2oC
Science and Technology Log: 
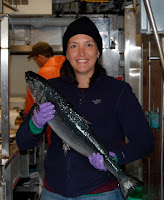
NOAA Fish Biologist Brian Beckman is our resident salmon vampire aboard the Oscar Dyson. He's been diligently collecting salmon blood samples anytime we catch them.  So I finally got a chance near the end of our journey to sit down and talk with Brian about why he want all those samples...

Insulin-like Growth Factor One (IGF1)
This is a ubiquitous protein that is made in the liver which causes calls to divide and grow.  So simply put, it causes growth.  Since the level of IGF1 in the blood is relatively stable, scientists can infer the growth rate of a fish by analyzing for this protein in the blood samples.  The growth rate is not an absolute value, but instead a relative comparison between fish populations.  Brian has been studying IGF1 levels in salmon off the coast of Oregon and is now trying to extrapolate or compare his findings with the salmon in the Bering Sea.  When averaging his finding over the region of coastal Oregon, he has been successful in correlating IGF1 levels in salmon with overall zooplankton abundance in the region.  
More food --> healthier juvenile salmon --> higher levels of IGF1 --> greater abundance of adult salmon  

Getting a Bit more technical..
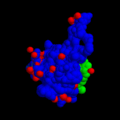
IGF1
After the blood samples are collected, Brian first centrifuges them to separate out the plasma.  The IGF1 is contained in the plasma portion of the blood.  (Remember that blood is considered a heterogeneous mixture so the components can be separated by physical means)  The plasma is removed and frozen for analysis.  An immune assay is then completed on the samples back in the lab.  

Brian also is concerned about the age of his salmon specimens.  Since bigger fish will be producing a steroid that stimulates the production of IGF1.  Therefore, bigger fish's IGF1 levels are a consequence of both the effect of the steroid and the fish's diet.  So, by collecting juvenile fish (no steroid production yet) a direct comparison can be made between the fish's diet and it's growth rate.


Birding on the Oscar Dyson
So on Thursday it was apparent to the crew and scientists that our fishing was done.  Troubles with the winch made balancing an open net in the water impossible.  Since our perfect 20 days of weather had us ahead of schedule, our sampling stations for this leg of the BASIS cruise were completed and our job was now done.  The scientists could now rest a bit and enjoy their cruise back to Dutch Harbor.  Except for two..... our colleagues from the Alaska Fish and Wildlife Service.  Tamara Zeller and Aaron Lang are aboard this cruise, not for fish or oceanographic samples; but instead they are here to perform an opportunistic survey about seabirds.  Armed only with a computer, binoculars and their savvy for visual details they collect data only when the ship is cruising so this last sprint to the harbor meant it was time for them to do some birding.
Tamara, Bruce, Aaron and Jeanette (left to right)
The computer pings and Tamara records what she sees from her window on the front starboard side of the bridge.  Indicators of ocean health, the Fish and Wildlife Service collects baseline data on seabird distribution and abundance in the Bering Sea.  Since most seabirds only come to land to breed, when ships like the Oscar Dyson has room aboard, a bird observer will take advantage of the opportunity to collect some data.

When I asked Aaron and Tamara what the most exciting bird this trip was, they had a hard time deciding between the two shown below.


Curlew
There's only about 5,000 left in the world


Horned Lark, Russian breeding flava subspecies
Land bird from Russia


Personal Log
The ending to our cruise on the Oscar Dyson will be bitter sweet.  While I'm happy to be on land again, I will certainly miss the camaraderie of all aboard the ship.  I could not have wished for a better group of people and a more professional crew.  Everyone went to extraordinary measures to help me understand all they do AND how they do it.  
 
A special thanks to Ed Farley, our Chief Scientist and Jeanette Gann, my bunkmate and friend these past twenty days..   I wonder how many morning I'll awake dreaming about collecting water samples from Niskin bottles??
 
Everyone on board and the NOAA crew was amazingly helpful and patient with the paparazzi teacher.  I'll miss you all and thank you all once again... 

Over and out..


Saturday, August 28, 2010

NOAA Log #5

It's Fish Feeding Time...                                                                    
NOAA Teacher at Sea: Natalie Macke
NOAA Ship: Oscar Dyson       Mission:  BASIS Survey
Geographical area of cruise: Bering Sea      Date: 8/28/2010
Weather Data from the Bridge :
Visibility :  <0.5 nautical miles (Wondering what a nautical mile is??)
Wind Direction: From the W at 20 knots
Sea wave height: 2-3ft      Swell waves: WSW, 4ft 
Sea temp:9.1 oC    Sea level pressure: 1013.0 mb    Air temp: 9.7 oC
Science and Technology Log: 
 
Euphausiid Specimens  (zooplankton)
We're up to station #40 now and everyone certainly has their routine down.  One type of sampling I have yet to cover is the microscopic life; the base of the food web.  A look at the marine fisheries food web quickly reveals that in order to support the commercial fisheries as well as the vast number of marine mammals and ocean birds, there must be an abundance of phytoplankton and zooplankton available in the Bering Sea.  Evidence of this food chain is demonstrated by dissecting the stomach of a salmon.  The sample (in the picture below) revealed that the salmon had recently dined on euphaussids (commonly known as krill).   Before getting into how the zooplankton samples 
are collected, first let me go back and touch on the base of the food web; phytoplankton.  These samples are collected from the Niskin bottles on the CTD each cast.  The samples are preserved with formalin and will be brought back to the lab for further analysis.  Now, back to the critters..  
At every sampling station on the side deck and immediately after each CTD cast, zooplankton net tows are completed.  There are three different tows being used for the BASIS survey. The first two are vertical tows where nets that are weighted are dropped to the seafloor and then brought back to the surface thus sampling a vertical water column. The pairovet, named from the fact that is was designed as a "pair of vertical egg tows" (designed to collect pelagic egg samples) has a netting mesh size of 150 microns.  The net is simply deployed with a weight on the bottom.  When it reaches the deepest part of the water column it is brought back to the surface collecting its' sample.  Another similar net with a 168 micron mesh size is named the Juday.  Once either of these nets is brought to the deck, it is washed down and anything caught is captured in the cod end (the name for the PVC bucket at the bottom of the net).  
Cod end for Bongo
Deploying the Bongo nets off the starboard side
The last type of tow that is completed for the BASIS survey uses the Bongo nets.  This tow is considered an oblique tow since the nets essentially are lowered to about 5m from the ocean bottom and towed for a certain length of time.  If you remember from the acoustics, in daylight hours the zooplankton migrate to the ocean bottom to hide from their prey.  Since our sampling is done in daylight hours, the deep sampling depth is where we expect to find the highest density of zooplankton sample.  The mesh sizes on the two nets of the Bongo are 335 and 505 microns.  This allows for sampling of zooplankton of different sizes.   The samples are collected on board and then taken back to the lab for analysis.  They are separated by species, counted and weighed.  Biomass and species composition is determined for each sample.  The majority of the zooplankton we have seen this cruise have been euphaussids and copepods of varying types.  


Oh where, oh where does the Internet go??
 
So as August winds down and the school year gears up, my connection to the Internet is becoming more and more important.  Since my Oceanography class is with the Virtual High School, I have to essentially set up my virtual classroom in these upcoming days.  I'll assume my esteemed colleagues will assist me in unpacking lab equipment back at home at my physical classroom. (Even though I know.. all my orders will mysteriously wind up in other labs, I'm assured they'll be safely placed away.) 
 

So I tracked down Vince Welton, our Electronic's Technician for some help understanding why sometimes I can surf, and why sometimes I can't.... 

Simple...  

Our Internet connection is via the geostationary satellite GE 23 at 172 degrees East.  This satellite transmits over most of the Pacific Ocean (see a coverage map).  Since this satellite is positioned on the equator, that means our receiver must look essentially due south for a signal.  When our ship is northbound, the mast and stack of the Oscar Dyson simply gets in the way.  Therefore... no Internet on northbound travels.  

The Oscar Dyson also has access to two Iridium satellites for communication as well as the GE 23.   These are the SAT-B which can transmit both data and voice communications and the VSAT which only allows voice transmission.  The ship can access this set of orbiting satellites when the GE 23 is unavailable due to course of travel or weather conditions. 


  Personal Log
 
Yesterday, I got permission to stay on the trawl deck during one of our station trawls.  It was fun to be outside down with the net.  Jeanette helped do some taping which I hope to (during a few Internet-less days ahead) compile to a video for my classes.  Of course as fate would have it, our catch for the day (shown below) was not one for the record books or even worth remembering at all..  I guess that's what the editing process is for hmmm...  

   In the Oceanography lab, we have started our primary productivity experiments and chlorophyll analysis so learning these new procedures has been interesting and given me lots of ideas for some research topics for Edelberg's class.  All in all, I am enjoying watching, learning and doing science here in eastern Bering Sea.  One week left.. 

Thursday, August 26, 2010

NOAA Log #4

The Sounds of Science...                                                                    
NOAA Teacher at Sea: Natalie Macke
NOAA Ship: Oscar Dyson       Mission:  BASIS Survey
Geographical area of cruise: Bering Sea      Date: 8/25/2010
Weather Data from the Bridge :
Visibility :  10+ nautical miles (Wondering what a nautical mile is??)
Wind Direction: From the ESE at 8 knots
Sea wave height: <1ft      Swell waves: NW, 1-2 ft 
Sea temp:6.8 oC    Sea level pressure: 1018.1 mb    Air temp: 8.2 oC
Science and Technology Log: 
 
Acoustician, Sandra Parker-Stetter
on the Bridge preparing to fish..
When you walk into the acoustics lab you are greeted with an impressive display of primary colors and fascinating images.  Sandy, our Acoustician is also there to greet you and help explain the science behind the images of sound.  She explained not only the basics of acoustic science; but also shared some fascinating biological phenomena that can be witnessed with this technology.   

So first some basics about the acoustics.  (Hoping BTW to make Sandy proud about her skills in teaching a physics phobic..   She only made my head hurt a few times..)  When you walk in the Acoustics Lab on the Oscar Dyson you will see there are six different acoustic displays in the lab:
  • 18 kHz & 38 kHz on one display  (These are more common to fishing vessels to distinguish larger fish from jellies, zooplankton and juvenile fish)
  • 70 kHz, 120kHz, 200kHz and a 70 kHz with a sideway view from the ship.
The acoustic sounders positioned on the ship's centerboard emit a ping that is transmitted directly downward from the boat (except one 70kHz pointed sideways).   
These pings each have a set characteristic frequency designated by the unit of a kiloHertz (kHz).   A  kilohertz simply is the thousands of cycles per second that the wave is transmitted.  Frequency is indirectly related to wavelength.  So if you think about what will fit in-between the waves in the left image it will make sense that lower frequency acoustics are used to identify larger things, while higher frequency captures images of much smaller species or individuals. 

Acoustics have the potential to not only identify schools of fish, but also discriminate between species types as well.  A characteristic scattering is observed from different types of fish depending on their internal structure (morphology) and composition.  For example, whether or not a fish has a swimbladder can be used for identification.  A swimbladder will cause a greater acoustic scattering.  In terms of composition, jellyfish are over 99% water.  The more like the composition of water, the less the sound bounces off the specimen.  Therefore, the scatter from the ping of the acoustics is weak and difficult to see on the monitor.   However, the jellyfish signature is shows up quite strong on the acoustic monitors.  In this case, the size and shape of the jellyfish causes the sound to scatter regardless of its' composition.  So acoustic analysis is not always as straight-forward as the scientists (and fishermen) would like.  So how do the scientist tell a jellyfish from a juvenile salmon?  Trawling data..   Part of the acoustic's mission on our BASIS cruise.  The scientists would like to develop patterns to match trawls with acoustic signals.  Therefore, acoustics can be used in the future more effectively to track and monitor pelagic populations.   


   Biological Phenomena Visualized with Acoustic Technology


Zooplankton Migration
Using the 200kHz acoustics, tracking the movement of the zooplankton is quite easy.  In the image to the left, taken and archived during the evening hours you can literally see how the zooplankton migrate toward the ocean surface as the sun sets (Around 10PM in these parts..).   Trying to avoid their predators, the zooplankton stay near the ocean bottom during the daylight hours, but migrates upward toward their food source, the phytoplankton, once darkness begins to onset.

Riding the Pycnocline
Another interesting physical oceanographic feature you can observe with acoustics is the pycnocline.  While you can't literally see the density change of the water using the acoustics aboard this ship, you can watch the fish hover immediately above this feature.  

18 kHz Acoustics
38 kHz Acoustics

  Personal Log:                                                                                                     

Yesterday morning's sunrise was one for the books..  Tuesday was a glorious, sunny day aboard the Dyson.. (Uh..  the answer is YES..  apparently Alaskans do sunbathe in 50 degree weather.  As long as the sun is out...  I won't mention any names.)  The daytime turned to an evening with a sky full of stars.  We then were treated to a spectacular sunrise the next morning with beautiful calm seas.  Thanks to Sandy, who captured the picture to the left that morning, while most of us were busy eating omelets and pancakes in the Mess Hall.  


It's fun sometimes when Sandy's right....    

Brian Beckman, Fish Biologist
After days of searching for the juvenile salmon, we finally found their playground.  One of trawls yesterday brought us over 2,000 sockeye juveniles along with a mess of jellies...  After accosting my colleagues with a few paparazzi moments, it was fun to join in to help sort out the catch.   And even sometimes when things don't work out perfectly, finding what you're looking for makes everything better. To the right is a snapshot of what happens when the bin doesn't stop in time and the fish/jelly mess overtakes the belt and scientists.  Now this is fishin'....

"Catch of the Day..."


Tuesday, August 24, 2010

NOAA Log #3

Bruce Wing, Invertebrate Biological
Oceanographer  "Jelly-man"
Everyone's Working for the "Jelly-man" ...  (atleast tonight)         

NOAA Teacher at Sea: Natalie Macke
NOAA Ship: Oscar Dyson       Mission:  BASIS Survey
Geographical area of cruise: Bering Sea      Date: 8/23/2010

Weather Data from the Bridge :
Visibility :  10+ nautical miles (Wondering what a nautical mile is??)
Wind Direction: From the NW at 17 knots
Sea wave height: 2-3ft      Swell wave direction: 4 ft 
Sea temp:7.7 oC    Sea level pressure: 1025.3 mb    Air temp:  9.5oC
Science and Technology Log: 
 
The result of each of our trawls thus far on the Oscar Dyson is a sample set of jellyfish.  There's at least one man on board who enjoys to see that sort of catch in the net.  (As opposed to our Chief Boatswain, Patrick...) Over this past weekend, the enthusiasm our lead scientist (Ed Farley, Salmon guy) showed for his ability to catch and recover these invertebrates, soared to a new all time high and a record for the Dyson crew.  (Once again, to the dismay of the well-respected fishermen working here on the Dyson  ..  not quite the story they want to bring home.)  On Sunday, our transects had us closer to the western coast of Alaska than our previous sample points.  Our Acoustician, Sandy Parker-Stetter, saw it all coming..  I think she probably said something like..  "Ed, we're in the jellies...".  The length of the trawl times can be modified, but how many jellies could there be anyway..  Well, that was quickly answered Sunday morning with a catch of 7,500 lbs of jellyfish (oh.. and a p. cod, salmon and pollock here or there to be fair)
7,500 lb trawl catch ~ "the jelly belly"


So one way to become familiar with the Mellanaster Chrysora is to be knee high deep in them.  From each of our station trawls, Bruce sorts the jellyfish by type and then collects counts, relative size and mass data from up to fifty jellyfish samples of each species type (Fifty..  remember this number...).  The video below is a view of our catch coming down the belt to be sorted by the scientists.  If you listen to the audio you'll hear Bruce reminding all of us what he needs for his sample set...

As our cruise progressed over the weekend the question of why and how we study jellyfish became my focus.  So I sat down with Bruce and he filled me in on what is known and a lot of what is unknown about these invertebrates.  
Measuring the Chrysora Mellanasters

Bruce has been a part of the BASIS cruises for the past 7-8 years.  In terms of changes in jellyfish he simply stated that people are seeming to notice them more, so potentially there may be an increase in their biomass.  This is what he and the scientists are trying to determine.  Just recently, the research community has shown an interest in learning more about their impact in various ecosystems.  The reality with research in this part of the world is that if it doesn't impact the industries, then money for learning more about them can be sparse.

There are basically four types of jellyfish that are common to the Bering Sea;

  • Chrysora Mellanaster
  • Cyanea Capillate (Lion's mane)
  • Phacellaphora Kamchatka (Fried egg Jelly)
  • Aurelia Labiata (Moon Jelly)

Cyanea Capillate
Phacellaphora Kamchatka
Aurelia Labiata

This time of year, the jellyfish are in their second (and last) phase.  The opaque regions you see in the center of their bodies are the gonads, the sexual organs of the invertebrate.  Once the jellyfish spawn, (shed their gametes) they die sometime in October in the Bering Sea.  This massive biomass then sinks to the bottom of the ocean where very highly popularized detritivores now have a new food source..  Yes..  it's crab-feeding time.  Well, that is atleast what the scientists suspect.  It is actually quite difficult to have proof of what is eating the jellyfish since they are >99% water.  Once consumed, the jellies break-down almost instantly.  So an inspection of stomach contents for evidence of feeding on jellyfish is near impossible.  But I think back as to how I acted at the Grand Aleutian with the "all you can eat" King Crab buffet..  and I think the likely-hood of the crabs eating jellyfish during their annual fall buffet is quite probable.  

Hauling in the big catch!!
So this brings me back to the enthusiasm of our Chief Scientist, Ed Farley.  Apparently, Bruce had shared the jellyfish / King Crab hypothesis with him...  because, that evening's trawl (10:00 PM with an amazing sunset for a backdrop) brought us our 10 ton catch of jellies.  Tasking the winch, breaking the net..  I won't really say how the fishermen reacted.  But the scientists were thrilled.  They had lots to sort through.  Sandy, the acoustician just shook her head.  


So the BASIS Cruise 2010 will now go down in infamy for the largest jelly-catch ever.  But on calm seas and a beautiful evening, sorting through jellyfish seems like the perfect thing to do.


Personal Log:                                                                          
I have certainly learned the importance of wearing the correct fishing gear on board the Dyson.  Every time I think I'm just stepping into the fish sorting room for a look, I wind up with that gelatinous goo all over.  I guess my new found fondness for jellyfish has created a type of attraction not clearly explained by laws of physics.  So, I will in the future save on trips to the laundry by making a more conscience effort to wear the "Bering Orange Rubber Suit".  (Mine name for it..  not theirs)


For those who have been concerned..  I did indeed find the gym and have been using the elliptical everyday.  Unfortunately, all this had done is provide me the mental freedom to enjoy more than my "Daily Recommended Serving" for Oreo Cookies.  Honestly, I've usually exceeded that amount by 9AM.  


Lastly, I have taken a number of photographs here on the Oscar Dyson which are worth sharing.  So I will make a page devoted to images I have caught which I'll update during the rest of our cruise..  Look for the link on the right hand column entitled, "Day on the Dyson". 

I have to say, our team is quite a handsome bunch!!


Saturday, August 21, 2010

NOAA Log #2

Ed Farley, Chief Scientist
 Learning from Guts and Gonads ...                                           

NOAA Teacher at Sea: Natalie Macke
NOAA Ship: Oscar Dyson       Mission:  BASIS Survey
Geographical area of cruise: Bering Sea      Date: 8/20/2010

Weather Data from the Bridge :
Visibility :  10 nautical miles (Wondering what a nautical mile is??)
Wind Direction: From the SE at 7 knots
Sea wave height: 1-2ft      Swell wave direction: 3 ft from the SW
Sea temp:7.5 oC    Sea level pressure: 1026.0 mb    Air temp:  10oC
Science and Technology Log: 
 
One of the objectives of the scientists on the BASIS cruise is to support Alaskan fisheries' efforts to better understand the life histories of the local salmon populations.  The goal is to determine an index to better forecast the juvenile salmon's return to western Alaska.  Thus management decisions may be made with a better understanding of long-term as well as short-term implications.  So to understand the science behind this, this chemistry teacher from the northeast had to first learn a bit about salmon....
THERE ARE FIVE TYPES FOUND IN THE PACIFIC NORTHWEST
Sockeye Salmon (Red Salmon)              Chum  (Dog Salmon)
King Salmon (Chinook)            Coho Salmon (Silvers)
Pink Salmon (Humpies)
  The Sockeye, King and Coho seem to be the favorite for eating.  While the Chum is often used in dog food (thus the name Dog Salmon) and the Pink Salmon is often used for canned products.  Salmon are considered a keystone species of the region; therefore, its' removal would have a deleterious impact to many levels of the ecosystem.  (Learn more about the Keystone Hypothesis
Top fish are a juvenile Chum and juvenile Red
Bottom is an immature Chum

Salmon are anadromous fish.  This simply means, while they spend most of their lives at sea in marine waters, they can and will return to fresh waters of lakes, streams and rivers to spawn.  The most tenuous part (in terms of environmental and
human impact to the general population) of a salmon's life seems to be in its' juvenile stage (1st year in the ocean).  Environmental conditions, availability of food and loss to bycatch by fisheries all have impacted the salmon populations as a whole.  Our short term mission here on the Oscar Dyson is to collect data from the salmon caught during our trawls.  Below is a bit more about the specific data the scientists hope to collect and the issues behind the science of that data.
Remember that the scientists hope to establish an index to forecast the juvenile salmon's return to western Alaska's spawning grounds.  This index is based on relative abundance and a fitness index.  So what is a fitness index for a fish??  (I asked too..)  It's simply the caloric content of the fish. 

Making a chemistry teacher happy with yet another example of the usefulness of calorimetry..   Yes, folk..  they burn the fish and measure how much energy is released, just like we do in class except not with a soda can.  The fish are frozen for this analysis and brought back to the lab for bomb calorimetry analysis.  

Various ecosystem indicators (Sea surface temperature, water column stability, types of of zooplankton, species composition and biomass) all affect both the fitness and abundance of the salmon.  Therefore, these are the data that scientists on board the Dyson are collecting.  Fish are sorted, separated, measured and then some are gutted.  Scale samples from the immature salmon are collected  for determination of age and growth history.  The scales have rings very much like the rings of a tree that can tell us not only how old a salmon is; but also, the general conditions of each growing season.  A band of small width would indicate a poorer/unhealthy condition for the fish.  Scientists have been collecting these scale samples for over fifty years and have started to compare the growth history of the salmon with climate cycles looking for overall correlations in order to predict how future climate change will impact these species.  (Want to learn more about using salmon scales for growth determination, read this article from Alaska Fish and Wildlife News)

The growth of a salmon depends much on its' diet.  Scientists have observed a shift in the diet of the salmon when there is a shift in zooplankton populations.  During warmer years a more stable water column develops with a pronounced thermocline.  [Really warm (about 10
degrees Celsius or so) on top and really cold on bottom (close to 0 degrees Celsius)]  Associated with this type of water column are the presence of zooplankton with a smaller lipid content (less fat).  As a result, the salmon (specifically the Sockeye) were observed to be eating pollock during warmer years.  Normally, the majority of the salmon diet is zooplankton.  During colder years, a less stable water column develops and zooplankton with a higher fat content were observed to be the main diet of the juveniles.  This link between the salmon and pollock populations causes an uncertainty in forecasting future salmon population changes.   The impact of the pollock fisheries has been mostly documented in the past simply in terms of bycatch.  Summer pollock fishing often results in bycatch of Chums; whereas the winter pollock season impacts the Chinook.  Understanding this newer biological relationship between salmon and pollock is important to predicting how changes in pollock populations will ultimately impact the future of salmon.  This future causes great concern among the local northern native groups who rely on the Chinook's population as a major food source. 

Personal Log:                                                                                                                
We were treated Thursday evening with some blue sky and then on Friday morning to a beautiful sunrise with a view of the mountains of Unimak Island.  When grey is a common daily theme any color is appreciated oh so more..  
MORNING VIEW
EVENING SKY


Wednesday, August 18, 2010

NOAA Log #1

A King Salmon catch
 "Learning a Different Sort of Job..."                                             

NOAA Teacher at Sea: Natalie Macke
NOAA Ship: Oscar Dyson       Mission:  BASIS Survey
Geographical area of cruise: Bering Sea      Date: 8/18/2010

Weather Data from the Bridge :
Visibility :  5 nautical miles (Wondering what a nautical mile is??)
Wind Direction: From the WSW at 16 knots
Sea wave height: 3ft      Swell wave direction: 5 ft from the WSW
Sea temp: 9.4oC    Sea level pressure: 1026.0 mb    Air temp:  8.8oC


 Science and Technology Log:
  It seems my background in chemical oceanography is coming into some use this cruise.  Since one of the scientists was not able to make the journey, the oceanography lab was short-handed.  So, I immediately was put to work to help collect and process the oceanography samples.  Below is a bit more about what that entails.

Scientists use an instrument referred to simply as a CTD (acronym for conductivity, temperature and depth) to electronically collect much of the physical ocean data.  Shown to the right, the CTD is a rosette with numerous electronic sensors and water collection bottles (known as Niskin bottles) that is slowly lowered into the ocean.  A cable electronically transmits data from the apparatus back up in real-time to the computer screen monitored by the scientists.  Viewing the data, an immediate decision can be made as to where (at what depth) a water sample should be retrieved for further analysis.    If you would like to view the data screen and see what this data looks like, view the page "CTD profile" in the right hand bar.

Jeanette, the oceanographer on board, is viewing the screen with her log book.  She'll look at the pycnocline and fluorescence data to decide where she'll "fire the Niskin bottles".  This simply means to send an electronic signal down to trigger the closing of the tube and thus capturing a water sample at that specific depth.  The general plan is to capture samples from 5m above the seafloor, two samples on the bottom and then top of the pycnocline.  Two additional samples will be also taken at the fluorescence maximum as well as near the surface.
  The fluorescence maximum is where the fluorometer has identified the greatest biomass of phytoplankton in the water column.  

Jeanette and I are pondering our catch of the day, "Oceanographer's style"

Once the CTD has been recovered back onboard, we take samples from the Niskin bottles for further study...  So what will we do with our samples??
-  Sample for nutrients such as nitrates and nitrites (food for the phytoplankton)
-  Sample for Oxygen-18 isotopes
-  Sample for different sizes of phytoplankton by filtering various aliquots using filter paper with different pore sizes.
Niskin bottle sampling


Filtering water samples
Once the samples are recovered from the Niskin bottles, (Each sample is given number associated with the depth from which it was collected) the samples are taken back to the oceanography lab for processing.  Samples are filtered for a given size of phytoplankton.  These sizes range from greater than 10 micrometers all the way down to GFF (greater than fine fraction)  meaning anything smaller will be bacteria and viruses.    The filter papers are recovered from the processing and will be brought back to shore for plankton analysis.  Ultimately, this data will help confirm the analysis completed electronically by the fluorometer on the CTD.  Our lab on the Oscar Dyson is quite nice and as long as seas remain calm as they have been, I have to say that my new job is one that I feel quite comfortable with...   
Oceanography Wet Lab
 Personal Log:
I have to say that I have gotten accustomed to the layout of the Oscar Dyson quite quickly and easily.  The levels are numbered with the Bridge being Level #1.  My berth is on Level #4 and the Oceanography Lab and the Mess hall are both on Level #3.  That's pretty much all that I really have to know..   Since seas have been calm, the gentle rocking has simply acted as a sedative to make you want to eat Oreo cookies and then take a nap.  I think I better locate the two gyms on board in the near future..  I have very much enjoyed getting to know the crew and scientists on board and look forward to learning much more from all of them.  Even drills are a bit different on the Dyson...


My very own "Gumby Suit"